1.2 Macroeconomic Concepts: Stock and Flow variables; Equilibrium and Disequilibrium; Static and Dynamic Equilibrium analysis
○○○ नमस्ते नमस्ते! अनि welcome to the second lesson of Unit 1. आज चाहिं यो introductory step मा तपाईंहरुको Owl दाई को सट्टा म आफैं देखिएको छु। र अब यो chapter मा, we will be covering Macroeconomic Concepts: Stock and Flow variables; Equilibrium and Disequilibrium; Static and Dynamic Equilibrium analysis. As usual, I ask you to carefully study all these notes and think aloud or write down what you’ve learnt for effective memory. So, let’s get started.

हुन्छ Sir …..अब सुरु गरिहालौं!
First मा यो stock and flow variables को concept बारे बुझौँ न त!
The economic variables that cover the economy as a whole are called macroeconomic variables. There are two types of such variables – stock variables and flow variables. They are explained below.
Stock Variables
Stock variables are the macroeconomic variables (or quantities) that are measured at a specific point of time, like the amount of money you have in your bank account right now.
Other examples of stock variables are:
- The number of currently unemployed (or employed) persons
- The amount of foreign exchange reserves
- The total amount of national debt, etc
Flow Variables
Flow variables are the macroeconomic variables (or quantities) that are measured over a period of time, like the money you earn over a period of month (i.e. monthly salary) or the money you earn over a period of a year (i.e. annual salary)
Other examples of flow variables are:
- Amount of money spent in a year
- Amount of goods produced in a year
- Amount of imports and exports in a year
अब Equilibrium and Disequilibrium बारे पढौं!
Equilibrium
Equilibrium means a state of balance or stability in the economy. In macroeconomics, equilibrium means a situation where the total demand for goods equals the total supply. This means there is no excess demand or excess supply in the economy.
| Total Demand = Total Supply |
For example, if the quantity of goods demanded by consumers matches the quantity of goods produced by businesses, we have an equilibrium in the market.
Equilibrium is a desirable state for the economy because it means that resources are being used efficiently.
Disequilibrium
Disequilibrium means a state of imbalance or instability in the economy. In macroeconomics, disequilibrium means a situation when the quantity demanded does not match the quantity supplied. This leads to either excess demand (shortage) or excess supply (surplus) in the market.
| Total Demand ≠ Total Supply |
For instance, if consumers want to buy more goods than what businesses are producing, it creates excess demand and leads to a shortage. Conversely, if businesses produce more goods than consumers want to buy, it creates excess supply and results in a surplus.
Disequilibrium is not a desirable state for the economy because it means that there is either a shortage or a surplus of goods and services.
Let’s explain the concept of equilibrium and disequilibrium with the help of the figure below.
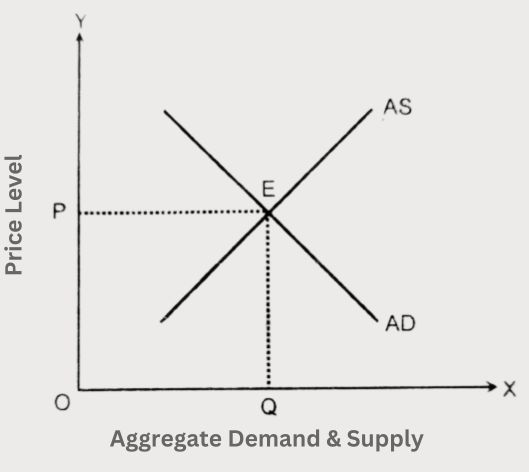
In the given figure, X-axis represents the aggregate demand and aggregate supply, whereas Y-axis represents the price level. The downward sloping curve AD represents the aggregate demand curve and the upward sloping curve AS represents the aggregate supply curve. The point E, where these two curves intersect, is the equilibrium point. At this point, the equilibrium price level is OP and the equilibrium quantity is OQ.
Here, we have to understand that at any price level above or below OP, there will be disequilibrium. In such situations, the aggregate demand is not equal to the aggregate supply. At any price level below OP, aggregate demand becomes greater than aggregate supply. Conversely, at any price level above OP, aggregate demand is less than aggregate supply. (अब price level बढेको अवस्थामा त aggregate demand कम त हुने नै भयो नि …)
लास्टमा अब Static and Dynamic Equilibrium Analysis बारे पढौं!

हैन यो माथिकोहरु बुझेरै नाच्या हो कि, त्यत्तिकै हो?
नोट पढ्ने हामी,
अनि नाच्ने चाहिं यिनीहरु???
○
○
Static and Dynamic Equilibrium Analysis
Static and dynamic equilibrium analysis are two different methods of analysing economic activities. These two methods of analysis are discussed separately below.
Static Equilibrium Analysis
When an economic activity is analysed under static or still conditions, it is known as static equilibrium analysis. Static equilibrium analysis is further classified into two types, as discussed below.
a. Macro Static Analysis:
Macro static equilibrium analysis is a type of equilibrium analysis that studies the final position of equilibrium of the whole economy at a particular point of time. It also analyses the relationships between macroeconomic variables in the final position of the equilibrium.
The following equation shows the final position of the equilibrium:
Y = C + I
where
Y = Aggregate income
C = Aggregate consumption
I = Aggregate investment
The concept of macro static analysis can be explained through the figure below.
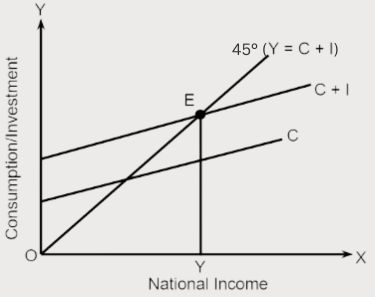
In the figure, X-axis represents national income and Y-axis represents consumption and investment. Point E is the equilibrium point where the aggregate demand curve (C+I) and the aggregate supply curve (45° line) intersect. At this point E, the equilibrium level of national income is OY. As aggregate demand and aggregate supply are related to the same point of time, it is considered as macro static analysis.
b. Comparative Macro Static Analysis:
Comparative macro static analysis is a type of analysis that does a comparative study of different equilibrium positions attained by the whole economy. It actually analyses the new and old equilibrium positions attained by the economy. However, it does not deal with the transitional period involved in the movement from one equilibrium point to another.
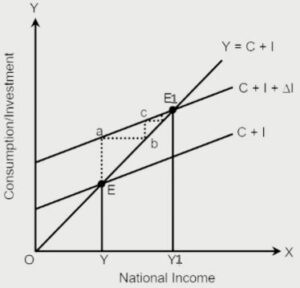
The concept of comparative macro static analysis can be explained through the figure below.

In the figure, E is the original point of equilibrium where aggregate demand curve (C+I) and the aggregate supply curve i.e 450 line (Y = C+I) are intersected. At this point, OY is the equilibrium level of national income. When there is an increase in investment, the aggregate demand curve shifts to C+ I + ΔI. As a result, the new equilibrium point is E1 and the new equilibrium national income is OY1.
This kind of comparative study of two equilibrium points E and E1, as seen in the figure, is known as comparative macro static analysis.
Dynamic Equilibrium Analysis
OR
Macro Dynamic Equilibrium Analysis
When an economic activity is analysed under dynamic or changing conditions, it is known as dynamic equilibrium analysis. This dynamic equilibrium analysis can also be called macro dynamic equilibrium analysis as it covers the economy as a whole.
इन द ल्याङ्ग्वेज अफ इकोनोमिक्स (अर्थशास्त्रको भाषामा भन्दा), Macro dynamic equilibrium analysis is a type of equilibrium analysis that studies the process by which the economy moves from one equilibrium point to another due to the change in macroeconomic variables.
The concept of macro dynamic equilibrium analysis can be explained through the figure below.
In the given figure, the initial equilibrium point is E and at this point, the level of income is OY. When there is an increase in investment, the level of income increases from OY to OY1. Due to this increase in income, there will be increase in consumption as well. To meet this increased consumption demand, more investment will be done. This whole process actually leads the economy to a new equilibrium point E1.
Macro dynamic equilibrium analysis is, therefore, the study of the process by which the economy moves from the initial equilibrium point E to a new equilibrium point E1 as seen in the figure.
Difference between Static Analysis and Dynamic Analysis of Macroeconomics
✓ Static analysis of macroeconomics or Macro static analysis explains the final position of equilibrium of the whole economy at a particular point of time. On the other hand, macro dynamic analysis explains the process by which the economy moves from one equilibrium point to another due to the change in macroeconomic variables.
✓ Macro static analysis shows a still picture of the whole economy. Macro dynamic analysis, on the other hand, shows the dynamic analysis of the whole economy.
FLASH CARD मा CHAPTER SUMMARY
अब यो Stock and Flow variables, Equilibrium and Disequilibrium, अनि Static and Dynamic Equilibrium analysis बारे जुन Notes हामीले पढ्यौं नि, त्यसलाई सम्झनको लागि एकपटक तलको Card मुनिको “Flip Card” मा click गरि हेर्नुहोस्।
○○○ के रहेछ त Stock and Flow variables भनेको?
Stock variables are the macroeconomic variables (or quantities) that are measured at a specific point of time, like the amount of money you have in your bank account right now.
Flow variables are the macroeconomic variables (or quantities) that are measured over a period of time, like the money you earn over a period of month (i.e. monthly salary) or the money you earn over a period of a year (i.e. annual salary)
सम्झन सक्नुहुन्छ त Equilibrium and Disequilibrium भनेको?
Equilibrium means a situation where the total demand for goods equals the total supply.
Disequilibrium means a situation when the quantity demanded does not match the quantity supplied.
○○○ अनि यो Static and Dynamic Equilibrium analysis याद छ त?
When an economic activity is analysed under static or still conditions, it is known as Static Equilibrium analysis. It is further classified into two types – macro static analysis & comparative macro static analysis.
When an economic activity is analysed under dynamic or changing conditions, it is known as Dynamic Equilibrium analysis. This is a type of equilibrium analysis that studies the process by which the economy moves from one equilibrium point to another due to the change in macroeconomic variables.

तपाईं अहिले TU Solution भन्ने tab मा हुनुहुन्छ
यहाँ तपाईंले यस chapter बाट अहिलेसम्म TU मा सोधिएका सबै question र त्यसको solution पाउनसक्नुहुन्छ। Question हरु chapter को topics अनुसार serially राखिएको छ।
ये ये! अनि एउटा question – हामीलाई अझै practice को लागि extra question हरु पनि भएको भए हुन्थ्यो नि, त्यस्तो छ र Owl दाई?
#के भन्नु हुन्छ त तपाईंको Owl दाईले?
Group A – Brief Answer Questions
Group A को लागि Chapterwise TU Solution
Stock and Flow Variables
Q) What is the difference between stock and flow variables? [2076, Q.No.1, TU]
Q) Differentiate stock and flow. [2079, Q.No.7, TU]
→ Stock variables are the macroeconomic variables that are measured at a specific point of time, like the amount of money you have in your bank account right now. On the other hand, flow variables are the macroeconomic variables that are measured over a period of time, like the money you earn over a period of month (i.e. monthly salary).
Equilibrium and Disequilibrium
Q) What do you mean by equilibrium in macroeconomics?
→ Equilibrium means a state of balance or stability in the economy. In macroeconomics, equilibrium means a situation where the total demand for goods equals the total supply. This means there is no excess demand or excess supply in the economy.
Q) What do you mean by disequilibrium in macroeconomics?
→ Disequilibrium means a state of imbalance or instability in the economy. In macroeconomics, disequilibrium means a situation when the quantity demanded does not match the quantity supplied. This leads to either excess demand (shortage) or excess supply (surplus) in the market.
Static and Dynamic Equilibrium Analysis
Q) Define macro static analysis.
→ Macro static equilibrium analysis is a type of equilibrium analysis that studies the final position of equilibrium of the whole economy at a particular point of time. It also analyses the relationships between macroeconomic variables in the final position of the equilibrium.
Q) What is comparative macro static analysis?
→ Comparative macro static analysis is a type of analysis that does a comparative study of different equilibrium positions attained by the whole economy. It actually analyses the new and old equilibrium positions attained by the economy. However, it does not deal with the transitional period involved in the movement from one equilibrium point to another.
Q) Define macro dynamic analysis.
Q) Define macro dynamics. [2072, Q.No.1, TU]
→ Macro dynamic equilibrium analysis is is a type of equilibrium analysis that studies the process by which the economy moves from one equilibrium point to another due to the change in macroeconomic variables.
Hey, Great Going!
Looks like you are on your way to becoming a super learner soon.

Group B – Descriptive Answer Questions
Group B को लागि Chapterwise TU Solution
Stock and Flow Variables
Q) Explain the macroeconomic concepts of stock and flow variables.
The economic variables that cover the economy as a whole are called macroeconomic variables. There are two types of such variables – stock variables and flow variables. They are explained below.
Stock Variables
Stock variables are the macroeconomic variables (or quantities) that are measured at a specific point of time, like the amount of money you have in your bank account right now.
Other examples of stock variables are:
- The number of currently unemployed (or employed) persons
- The amount of foreign exchange reserves
- The total amount of national debt, etc
Flow Variables
Flow variables are the macroeconomic variables (or quantities) that are measured over a period of time, like the money you earn over a period of month (i.e. monthly salary) or the money you earn over a period of a year (i.e. annual salary)
Other examples of flow variables are:
- Amount of money spent in a year
- Amount of goods produced in a year
- Amount of imports and exports in a year
Equilibrium and Disequilibrium
Q) Explain the macroeconomic concepts of equilibrium and disequilibrium.
Equilibrium
Equilibrium means a state of balance or stability in the economy. In macroeconomics, equilibrium means a situation where the total demand for goods equals the total supply. This means there is no excess demand or excess supply in the economy.
| Total Demand = Total Supply |
For example, if the quantity of goods demanded by consumers matches the quantity of goods produced by businesses, we have an equilibrium in the market.
Equilibrium is a desirable state for the economy because it means that resources are being used efficiently.
Disequilibrium
Disequilibrium means a state of imbalance or instability in the economy. In macroeconomics, disequilibrium means a situation when the quantity demanded does not match the quantity supplied. This leads to either excess demand (shortage) or excess supply (surplus) in the market.
| Total Demand ≠ Total Supply |
For instance, if consumers want to buy more goods than what businesses are producing, it creates excess demand and leads to a shortage. Conversely, if businesses produce more goods than consumers want to buy, it creates excess supply and results in a surplus.
Disequilibrium is not a desirable state for the economy because it means that there is either a shortage or a surplus of goods and services.
Let’s explain the concept of equilibrium and disequilibrium with the help of the figure below.
In the given figure, X-axis represents the aggregate demand and aggregate supply, whereas Y-axis represents the price level. The downward sloping curve AD represents the aggregate demand curve and the upward sloping curve AS represents the aggregate supply curve. The point E, where these two curves intersect, is the equilibrium point. At this point, the equilibrium price level is OP and the equilibrium quantity is OQ.
Here, we have to understand that at any price level above or below OP, there will be disequilibrium. In such situations, the aggregate demand is not equal to the aggregate supply. At any price level below OP, aggregate demand becomes greater than aggregate supply. Conversely, at any price level above OP, aggregate demand is less than aggregate supply. (अब price level बढेको अवस्थामा त aggregate demand कम त हुने नै भयो नि …)
Static and Dynamic Equilibrium Analysis
Q) Describe the static analysis of macroeconomics. [2080, Q.No.11, TU]
Static Equilibrium Analysis
When an economic activity is analysed under static or still conditions, it is known as static equilibrium analysis. Static equilibrium analysis is further classified into two types, as discussed below.
a. Macro Static Analysis:
Macro static equilibrium analysis is a type of equilibrium analysis that studies the final position of equilibrium of the whole economy at a particular point of time. It also analyses the relationships between macroeconomic variables in the final position of the equilibrium.
The following equation shows the final position of the equilibrium:
Y = C + I
where
Y = Aggregate income
C = Aggregate consumption
I = Aggregate investment
The concept of macro static analysis can be explained through the figure below.
In the figure, X-axis represents national income and Y-axis represents consumption and investment. Point E is the equilibrium point where the aggregate demand curve (C+I) and the aggregate supply curve (45° line) intersect. At this point E, the equilibrium level of national income is OY. As aggregate demand and aggregate supply are related to the same point of time, it is considered as macro static analysis.
b. Comparative Macro Static Analysis:
Comparative macro static analysis is a type of analysis that does a comparative study of different equilibrium positions attained by the whole economy. It actually analyses the new and old equilibrium positions attained by the economy. However, it does not deal with the transitional period involved in the movement from one equilibrium point to another.
The concept of comparative macro static analysis can be explained through the figure below.
In the figure, E is the original point of equilibrium where aggregate demand curve (C+I) and the aggregate supply curve i.e 450 line (Y = C+I) are intersected. At this point, OY is the equilibrium level of national income. When there is an increase in investment, the aggregate demand curve shifts to C+ I + ΔI. As a result, the new equilibrium point is E1 and the new equilibrium national income is OY1.
This kind of comparative study of two equilibrium points E and E1, as seen in the figure, is known as comparative macro static analysis.
Q) Explain the macroeconomic concepts of static and dynamic equilibrium analysis. What is the difference between these two types of equilibrium analysis?
Static and dynamic equilibrium analysis are two different methods of analysing economic activities. These two methods of analysis are discussed separately below.
Static Equilibrium Analysis
When an economic activity is analysed under static or still conditions, it is known as static equilibrium analysis. Static equilibrium analysis is further classified into two types, as discussed below.
a. Macro Static Analysis:
Macro static equilibrium analysis is a type of equilibrium analysis that studies the final position of equilibrium of the whole economy at a particular point of time. It also analyses the relationships between macroeconomic variables in the final position of the equilibrium.
The following equation shows the final position of the equilibrium:
Y = C + I
where
Y = Aggregate income
C = Aggregate consumption
I = Aggregate investment
The concept of macro static analysis can be explained through the figure below.
In the figure, X-axis represents national income and Y-axis represents consumption and investment. Point E is the equilibrium point where the aggregate demand curve (C+I) and the aggregate supply curve (45° line) intersect. At this point E, the equilibrium level of national income is OY. As aggregate demand and aggregate supply are related to the same point of time, it is considered as macro static analysis.
b. Comparative Macro Static Analysis:
Comparative macro static analysis is a type of analysis that does a comparative study of different equilibrium positions attained by the whole economy. It actually analyses the new and old equilibrium positions attained by the economy. However, it does not deal with the transitional period involved in the movement from one equilibrium point to another.
The concept of comparative macro static analysis can be explained through the figure below.
In the figure, E is the original point of equilibrium where aggregate demand curve (C+I) and the aggregate supply curve i.e 450 line (Y = C+I) are intersected. At this point, OY is the equilibrium level of national income. When there is an increase in investment, the aggregate demand curve shifts to C+ I + ΔI. As a result, the new equilibrium point is E1 and the new equilibrium national income is OY1.
This kind of comparative study of two equilibrium points E and E1, as seen in the figure, is known as comparative macro static analysis.
Dynamic Equilibrium Analysis or Macro Dynamic Equilibrium Analysis
When an economic activity is analysed under dynamic or changing conditions, it is known as dynamic equilibrium analysis. This dynamic equilibrium analysis can also be called macro dynamic equilibrium analysis as it covers the economy as a whole.
Macro Dynamic Equilibrium Analysis:
Macro dynamic equilibrium analysis is is a type of equilibrium analysis that studies the process by which the economy moves from one equilibrium point to another due to the change in macroeconomic variables.
The concept of macro dynamic equilibrium analysis can be explained through the figure below.
In the given figure, the initial equilibrium point is E and at this point, the level of income is OY. When there is an increase in investment, the level of income increases from OY to OY1. Due to this increase in income, there will be increase in consumption as well. To meet this increased consumption demand, more investment will be done. This whole process actually leads the economy to a new equilibrium point E1.
Macro dynamic equilibrium analysis is, therefore, the study of the process by which the economy moves from the initial equilibrium point E to a new equilibrium point E1 as seen in the figure.
Q) Explain the dynamic analysis of macroeconomics. How does it differ from macro-static analysis? [7+3] [2078, Q.No.12, TU]
Dynamic Analysis of Macroeconomics
[Note: Dynamic analysis of macroeconomics means the same as macro dynamic equilibrium analysis. Therefore, please refer to the “Macro Dynamic Equilibrium Analysis” section just above for the explanation of this topic.]
Difference between Static Analysis and Dynamic Analysis of Macroeconomics
✓ Static analysis of macroeconomics or Macro static analysis explains the final position of equilibrium of the whole economy at a particular point of time. On the other hand, macro dynamic analysis explains the process by which the economy moves from one equilibrium point to another due to the change in macroeconomic variables.
✓ Macro static analysis shows a still picture of the whole economy. Macro dynamic analysis, on the other hand, shows the dynamic analysis of the whole economy.
Group C – Analytical Answer Questions
Group C को लागि Chapterwise TU Solution