
2.3 Market Equilibrium || Effect of Changes in Demand & Supply and Effect of Govt Policy on Market Equilibrium
… Hey there! Welcome to the third lesson of Unit 2. In this lesson, we will be covering Market Equilibrium & Effect of Changes in Demand & Supply and Effect of Govt Policy on Market Equilibrium. As usual, I ask you to carefully study all these notes and think aloud or write down what you’ve learnt for effective memory. So, let’s get started.


हुन्छ Sir …..अब सुरू गरिहालौं!
Group A – Brief Answer Questions
Chapterwise Notes in Q & A Format for Group A ( with TU Soln )
Market Equilibrium
Q) Define market equilibrium
→ Market equilibrium refers to the state of balance in a market where the quantity demanded is equal to the quantity supplied.
Q) What is meant by equilibrium price?
→ Equilibrium price refers to the price level at which the quantity demanded is equal to the quantity supplied (i.e Qd = Qs)
Effect of Govt. Policy (Tax, Subsidy & Price Control) in Market Equilibrium
Q) What is price control?
→ Price control is a government policy or regulation that sets limits on the prices that can be charged for goods or services. The purpose of price controls is often to protect consumers from excessive pricing, particularly in essential goods such as food, medicine, or housing, or to address perceived market failures.
→ Price controls can take various forms, including price ceilings (a maximum price that can be charged), price floors (a minimum price that must be charged), or price stabilization (limiting the changeability of prices). Price controls can also be temporary or permanent, and they may be implemented through various mechanisms, such as laws, regulations, or direct government intervention in the market.
Brief Numerical Answer Questions
Group B – Descriptive Answer Questions
Chapterwise Notes in Q & A Format for Group B ( with TU Soln )
Concept of Market Equilibrium
Q) Explain the concept of market equilibrium.
Or, Explain how market equilibrium is attained.
Or, Define market equilibrium. Explain how equilibrium price and quantity are determined in the free market economy.
Or, Define surpluses and shortages and explain how they cause the price to move towards market equilibrium.
What is Market Equilibrium
Market equilibrium is a state in which the demand for a certain good is equal to the supply of that good, resulting in a stable price. In other words, it is the point where the quantity of goods demanded by consumers is equal to the quantity supplied by producers.
At this point, there is neither surplus nor shortage of the good, and the market is considered to be balanced. The price of a good at this balanced state is called equilibrium price and the quantity is called equilibrium quantity.
But,when the market price is not in equilibrium state, there can be either surplus of goods or shortage of goods. Now let us try to understand how the market achieves equilibrium in such situation or how market equilibrium is determined in such circumstance.
How Market Equilibrium is Attained
If the market price is above the equilibrium price, producers will supply more of the product than consumers are willing to buy, and there will be a surplus (excess supply). To get rid of the surplus, producers will have to lower the price, and this will continue until the market reaches equilibrium.
If the market price is below the equilibrium price, consumers will demand more of the product than producers are willing to supply, and there will be a shortage (excess demand). To satisfy the demand, producers will increase the price, and this will continue until the market reaches equilibrium.
In this wy, the actions of producers and consumers will move the market towards equilibrium state.
This process can be explained graphically using the figure below. In the figure, the quantity is measured along the X-axis and the price is measured along the Y-axis. There is a downward sloping curve DD, representing the demand curve and there is an upward sloping curve SS, representing the supply curve. These 2 curves intersect(cross) at point E which is the market equilibrium point. At this point, the equilibrium price and quantity are determined as Rs 6 and 60 units respectively.
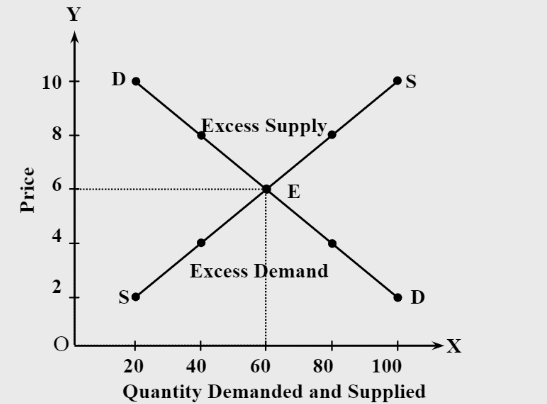
Looking at the diagram again, we also see that when the price is higher than the equilibrium price (i.e Rs 6), there is excess supply (leading to surplus) of the product. On the other hand, when the price is lower than the equilibrium price, there is excess demand (leading to shortage) of the product. Both of these excess supply and excess demand are unwanted situation for the economy and this can be corrected by adjusting the price to an acceptable value which is actually the equilibrium price.
Effect of Changes in Demand & Supply on Market Equilibrium
Q) Explain the effect of shift in demand and supply curve on the equilibrium price and quantity.
Or, Explain the effect of changes in demand and supply on market equilibrium.
Or, Explain the impact of a change in demand or supply on equilibrium price and quantity.
Effects of Changes (Shifts) in Demand & Supply Curve on Market Equilibrium
The shift in demand and supply curve (or changes in demand and supply) can have a noticeable impact on the equilibrium price and quantity or on market equilibrium. The equilibrium price and quantity will either increase or decrease depending on the nature of shits in the demand and supply curves.
The diagrams below show the effects of shift in demand curve, supply curve or both on the market equilibrium (or on the equilibrium price and quantity)
a. Effect of Shift in Demand Curve: When demand curve shifts, the initial equilibrium price and quantity will change. The rightward shift in demand curve will cause increase in price and quantity. On the other hand, leftward shift in demand curve will cause fall in price and quantity.
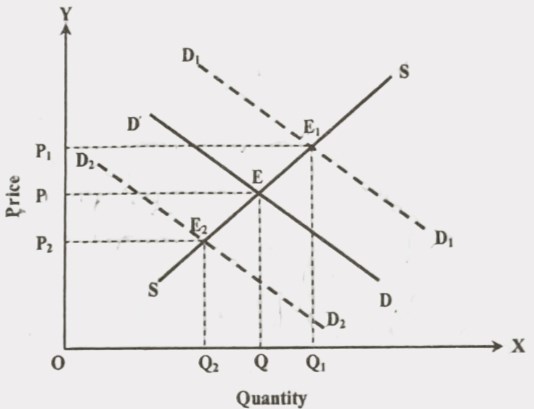
In the above diagram, point E represents the initial equilibrium point and DD represents the initial demand curve. When this demand curve shifts rightward i.e. from DD to D1D1, a new equilibrium point E1 will be attained. As a result, both the initial equilibrium price and quantity will increase from OP1 to OP2 and OQ1 to OQ2 respectively. On the other hand, when the demand curve shifts leftward from DD to D2D2, a different equilibrium point E2 is attained. In such situation, both the equilibrium price and quantity will fall from OP to OP2 and OQ to OQ2 respectively.
b. Effect of Shift in Supply Curve: When supply curve shifts rightward, equilibrium price will fall but quantity will rise. On the other hand, when supply curve shifts leftward, equilibrium price will rise but quantity will fall.
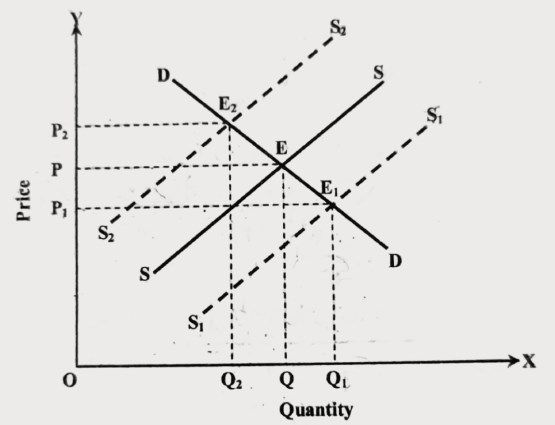
In the figure, E is the initial equilibrium point. If supply curve shifts rightward from SS to S1S1 the new equilibrium point is attained at E1. It shows the fall in equilibrium price from OP to OP1 and increase in quantity from OQ to OQ1. Similarly, if supply curve shifts leftward from SS to S2S2 the new equilibrium point is attained at E2. It shows the rise in equilibrium price from OP to OP2 and decrease in quantity from OQ to OQ2.
c. Effect of Shift in Both Demand and Supply Curves: When there is simultaneous shift in demand and supply curves, equilibrium price and quantity will change. But this depends on the extent of shift in demand and supply curves.
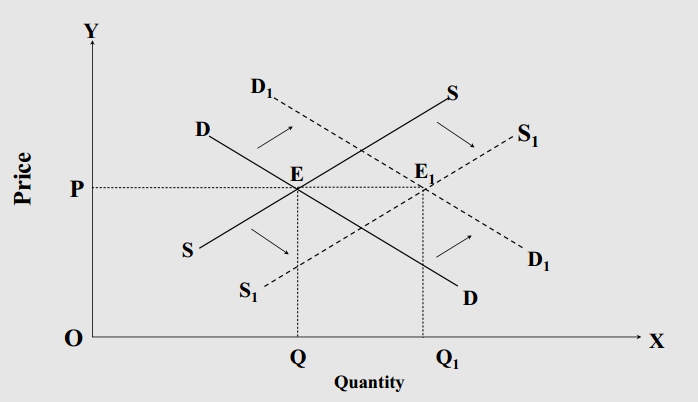
In the figure, E is the initial equilibrium point. When both demand and supply curves simultaneously shift from SS to S1S1 and DD to D1D1. The new equilibrium point is attained as E1. The equilibrium price is constant at OP but new equilibrium quantity OQ1 is more than initial quantity OQ. It is due to equal and parallel shift in demand and supply curves.
Effect of Govt. Policy (Tax, Subsidy & Price Control) on Market Equilibrium
Q) Explain the effects of government policy on market equilibrium.
Effect of Govt. Policy (Tax, Subsidy & Price Control) on Market Equilibrium
Government policies such as taxes, subsidies, and price controls can have a significant impact on market equilibrium. Here are the effects of each of these policies:
1. Effect of govt tax policy in market equilibrium:
When the government imposes taxes on a product, it increases the cost of production for the sellers, leading to a decrease in supply. As a result, the supply curve shifts to the left, and the equilibrium price increases, while the equilibrium quantity decreases. This is because the higher cost of production reduces the profit margin for the sellers, which causes them to supply less of the product.
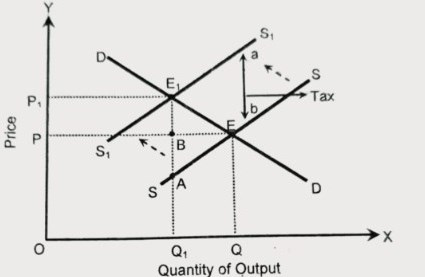
In the figure X-axis represents quantity of output and Y-axis represents price. The downward sloping curve DD represents Demand curve and upward sloping curve SS represents initial supply curve. The demand curve DD and initial supply curve SS are intersecting each other at point E, which is the initial equilibrium point. Hence, initial equilibrium quantity is OQ and equilibrium price is OP. Let us suppose, government imposes indirect tax, i.e. value added tax equal to ‘ab’ per unit output. Then the initial supply curve SS will shift leftward from SS to S1S1. Consequently, new equilibrium point E1 is obtained, which shows decrease in supply from OQ to OQ1 and rise price from OP to OP. It is clear that taxes reduce output and raise the price.
2. Effect of subsidy policy in market equilibrium:
Subsidies are payments made by the government to producers to encourage production. When the government provides a subsidy to a producer, it reduces the cost of production, which increases the supply of the product. This is because producers can produce the product at a lower cost, allowing them to offer it at a lower price. As a result, the supply curve shifts to the right. The increase in supply causes the equilibrium price to decrease and the equilibrium quantity to increase.
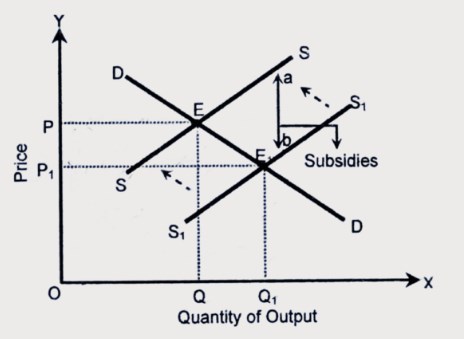
In the figure, SS is the initial market supply curve and DD is market demand curve. These two curves are intersecting each other at point E, which is the equilibrium point. The equilibrium market price and quantity of output are OP and OQ respectively. Let us suppose, government provides subsidies equal to ‘ab’ per unit output. Then, the initial supply curve SS will shift rightward to S1S1. Consequently, new equilibrium point will be E1 and equilibrium market price and supply will be OP1 and OQ1 respectively. Thus, it is clear that subsidies reduce price and raise supply.
3. Effect of price control policy in market equilibrium:
Price controls are government policies that set a maximum price (price ceiling) or minimum price (price floor) for a product. When a price control is imposed, it can have significant effects on the market equilibrium. Lets discuss the effect of each type of price control in market equilibrium.
i) Price ceiling:
A price ceiling is a government policy that prevents a price from rising above a certain level (the “ceiling”). As per this policy (यो पोलिसी अनुसार), the government sets a maximum price that a seller is allowed to charge for a product (त्यो भन्दा मुल्य बढाउन नपाइने गरि).
When price ceiling is set above the existing market price, there is no direct effect. But, when price ceiling is set below the existing market price, the market faces the problem of shortage.
When price ceiling is set below the market price, producers will begin to slow or stop their production process causing less supply of commodity in the market. On the other hand, demand of the consumers for such commodity increases with the fall in price. And with this imbalance between supply and demand of the commodity, shortage is created in the market. Such shortage can lead to black market, a long queing or line of customers and poor-quality products in the market.
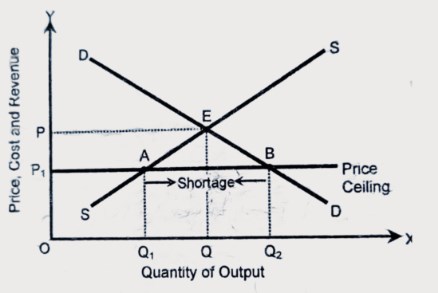
In the figure, the demand curve DD and supply curve SS are intersecting each other at point E, which is the equilibrium point. Hence, equilibrium price and quantity are OP and OQ respectively. When maximum price OP1 is imposed by the government, i.e. below the equilibrium price OP, quantity demanded increases to OQ2 and quantity supplied decreases to OQ1. A shortage of Q1Q2 arises in the market due to setting of ceiling prices, which is regarded as the major problem with a ceiling price.
i) Price floor:
A price floor is a government policy that prevents a price from falling below a certain level (the “floor”).
As per this policy (यो पोलिसी अनुसार), the government sets a minimum price that can be charged for a particular product ( त्यो भन्दा मुल्य नघट्ने गरि).The idea behind a price floor is to prevent the price of a product from falling too low, which could lead to lower earning for producers and a reduction in the quantity supplied. Thus, a price floor is usually put in place to protect vulnerable (असुरक्षित वा अप्ठेरो अवास्थाम्म भएका) suppliers. For example, a government may implement a price floor for agricultural products to protect farmers’ earning.
If price floor is less than market equilibrium price then it has no impact on the economy. However, this type of policy can have some unwanted effect in the economy if price floor is set above the market equilibrium price. In such situation, there will be excess supply or surplus of the product.
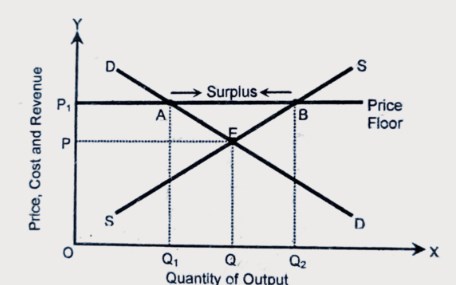
In the figure, the demand curve DD and supply curve SS are intersecting each other at point E which is the equilibrium point.Hence, equilibrium quantity and price are OQ and OP respectively. Let us suppose, govrrnment imposes minimum price OP. Then it results contraction in demand to OQ1 and extension of supply of OQ2. In other words, there is excess supply or surplus equal to Q1Q2. This is regarded as the major problem with price floor.
Descriptive Numerical Answer Questions
Q) Let, individual demand function Qdx = 12 – 2Px and market supply function Qsx = 20Px. If there are 10 individual customers in the market for the commodity X, find:
a) Market demand function.
b) Market demand schedule and market supply schedule.
c) Derive market demand curve and market supply curve.
d) Obtain equilibrium price and quantity mathematically.
Solution
a) Given, individual demand function is Qdx = 12-2Px
As there are 10 individual customers in the market, market demand function is
Qdx= (12-2Px) × 10
Or, Qdx = 120-20Px
b) The market demand and market supply schedule is:
| Price (Rs) | Market Demand Function: Qdx = 120 – 20Px | Market Supply Function: Qsx = 20Px |
|---|---|---|
| 1 | 120 – 20×1 = 100 | 20×1 = 20 |
| 2 | 120 – 20×2 = 80 | 20×2 = 40 |
| 3 | 120 – 20×3 = 60 | 20×3 = 60 |
| 4 | 120 – 20×4 = 40 | 20×4 = 80 |
| 5 | 120 – 20×5 = 20 | 20×5 = 100 |
In the above table Qdx = Qsx = 60, so market equilibrium price is Rs. 3 and equilibrium quantity is 60 units.
c) Derivation of market demand curve and market supply curve:
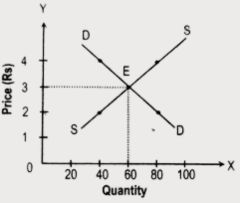
d) The market equilibrium condition is: Qdx = Qsx
or, 120-20Px = 20Px
or, 120 = 20Px + 20Px
or, 120 = 40Px
or, 120/40 = Px
or, Px = 3.
Putting Px = 3 in Qdx or Qsx, we get
Qdx = 120-20P
= 120-20 × 3
= 120-60
= 60.
Therefore, the equilibrium price and quantity are Rs. 3 and 60 units
respectively.
Q) Let the demand function be Qd = 150 – 5Px and supply function be Qs = 10Px.
Answer the following questions:
a. Graph the demand and supply equations and show the equilibrium price and quantity.
b. If demand increases to Qd’ = 150 – 10Px and supply increases to Qs’ = 50 + 10Px, find out the new equilibrium price and quantity. Also explain the cause of equilibrium price and quantity.
Solution
Here, the given demand and supply functions are:
Qd = 150 – 5Px
Qs = 10Px
Assigning different price values to the given demand and supply function, we can construct the following schedule.
| Price (Rs) | Quantity demanded (Qd) = 150 -5Px | Quantity supplied (Qs) = 10Px |
|---|---|---|
| 5 | 150 – 5×5 = 125 | 10×5 = 50 |
| 10 | 150 – 5×10 = 100 | 10×10 = 100 |
| 15 | 150 – 5×15 = 75 | 10×15 = 150 |
On the basis of the above schedule, we can plot the following graph representing demand and supply curve.
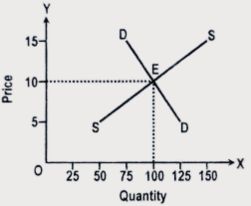
In the graph we can see that the demand curve DD and the supply curve SS are intersecting at point E. Therefore, at this point in the graph, the equilibrium price and quantity are Rs 10 and 100 units respectively.
b. Let’s move to question ‘b’ now. According to the question, the new (changed) demand and supply functions are:
Qd’ = 150 – 10Px
Qs’ = 50 + 10Px
For equilibrium,
Qd’ = Qs’
Or, 150 – 10Px = 50 + 10Px
Or, – 10Px – 10Px = 50 – 150
Or, -20Px = -100
Or, Px = 5
Putting the value of Px in the new demand and supply functions, we have:
Qd’ = 150 – 10Px = 150 – 10 × 5 = 100 units
Qs’ = 50 + 10Px = 50 + 10 × 5 = 100 units
Thus, the new equilibrium price is Rs 5 and equilibrium quantity is 100 units. We can see that the equilibrium price has decreased from Rs 10 to Rs 5 but equilibrium quantity has remained the same. This is because of a greater degree of increase in supply compared to the increase in demand.
Effect of Govt. Policy (Tax ) on Market Equilibrium
Q) The demand and supply functions are Qd = 85 – 2P and Qs = 37 + 3P. Calculate the equilibrium price and quantity if the government imposes the specific sales tax at the rate of Rs. 4 per unit.
Solution
Given,
Qd = 85 – 2P
Qs = 37 + 3P
and sale tax (T) = Rs. 4 per unit.
Since, the government imposes the specific sales tax at the rate of Rs. 4
per unit, so new supply function is
Qs = a + b (P-T)
= 37+3(P-4)
= 37+3P-12
= 25+ 3P
The market equilibrium condition is
Qd = Qs
or, 85-2P = 25+ 3P
or, 85-25 = 3P + 2 P
or, 60 = 5P
or, 60/5 = P
or, P = 12.
Thus, the equilibrium price (P) = Rs. 12.
And the equilibrium quantity (Qd = Qs) = 85-2P
= 85-2 × 12
= 85-24
= 61 units.
Q) The market demand and supply functions are Qd = 300 – 5P and Qs = 100 + 20P.
a) Calculate the equilibrium price and quantity.
b) If the government imposes the specific sales tax at the rate of Rs. 2.5 per unit, what will be the new equilibrium price and quantity?
Solution
Given,
Qd=300 – 5P
Qs = 100 + 20P
and sale tax (T) = Rs. 2.5 per unit.
a) The market equilibrium condition is
Qd=Qs
or, 300-5P = 100+ 20P
or, 300-100 = 20P+ 5P
or, 200 = 25P
or, 200/25= P
or, P = 8.
Thus, the equilibrium price (P) = Rs. 8.
And, the equilibrium quantity (Qd = Qs) = 300 – 5P
= 300-5 x 8
= 300-40
= 260 units.
b) When the government imposes the specific sales tax at the rate of Rs. 2.5 per unit, the new supply function will be:
Qs = a + b (P – T)
= 100 + 20 (P – 2.5)
= 100 + 20P – 50
= 50 + 20P.
The market equilibrium condition is
Qd = Qs
or, 300-5P 50+ 20P
or, 300-5020P + 5P
or, 250 = 25P
or, 250/25= P
or, P = 10.
Thus, the equilibrium price (P) = Rs. 10.
And the equilibrium quantity (Qd=Qs) = 300 – 5P
= 300-5 × 10
= 300 -50
= 250 units.
बुझ्नको लागि मात्रै:
From the above calculation, it is clear that when the government imposes tax on any goods, it will cause an increase in price but decrease in output.
Effect of Govt. Policy (Subsidy) on Market Equilibrium
Q) The demand and supply functions are Qd= 300 – 5P and Qs=-150 + 5P. Calculate the equilibrium price and quantity. If the government give production subsidy on goods at the rate of Rs. 2 per unit, what will be the equilibrium price and output?
Solution
Given,
Qd=300-5P
Qs = -150 + 5P
and consumption subsidy (S) = Rs. 2 per unit.
a) The market equilibrium condition is:
Qd = Qs
or, 300 – 5P = 150 + 5P
or, 300 + 150 = 5P + 5P
or, 450 = 10P
or, 450/10 = P
or, P = 45.
Thus, the equilibrium price (P) = Rs. 45.
And the equilibrium quantity (Qd = Qs) = 300 – 5P
= 300-5 x 45
= 300-225
= 75 units.
b) When the government gives production subsidy on goods at the rate of
Rs. 2 per unit, the new supply function will be:
Qs = a + b(Px+S)
=-150+5(P+2)
=-150+5P+ 10
=-140+5P
The market equilibrium condition is
Qd = Qs
or, 300 – 5P = 140 + 5P
or, 300+ 140 = 5P + 5P
or, 440 = 10P
or, 440/10 = P
or, P = 44.
Thus, the equilibrium price (P) = Rs. 44.
And the equilibrium quantity (Qd = Qs) = 300 – 5P
= 300-5 x 44
=300-220
= 80 units.
बुझ्नको लागि मात्रै:
From the above calculation, it is clear that when the government gives production subsidy on goods, this will cause decrease in price and increase in output.
Q) The demand and supply functions are Qd = 75 – 1.5P and Qs = 30 + 3P. Calculate the equilibrium price and quantity. If the government give consumption subsidy on goods at the rate of Rs. 6 per unit, what will be the equilibrium price and output?
Solution
Given,
Qd = 75 – 1.5P
Qs = 30 + 3P
and consumption subsidy (C) = Rs. 6 per unit.
a) The market equilibrium condition is:
Qd = Qs
or, 75 – 1.5P = 30 + 3P
or, 75 – 30 = 3P + 1.5P
or, 45 = 4.5P
or, 45/4.5= P
or, P = 10.
Thus, the equilibrium price (P) = Rs. 10.
And the equilibrium quantity (Qd = Qs) = 75 – 1.5P
=75 – 1.5 × 10
= 75 – 15
= 60 units.
b) When the government gives consumption subsidy on goods at the rate
of Rs. 6 per unit, the new demand function will be:
Qd=a – b(P – C)
=75 – 1.5(P – 6)
= 75 – 1.5P + 9
= 84 – 1.5P.
The market equilibrium condition is:
Qd = Qs
or, 84 – 1.5P = 30 + 3P
or, 84 -30 = 3P + 1.5P
or, 54 = 4.5P
or, 54/4.5 = P
or, P = 12
Thus, the equilibrium price (P) = Rs. 12.
And the equilibrium quantity (Qd = Qs) = 84 – 1.5P
= 84 – 1.5 x 12
= 84 – 18
= 66 units.
Group C – Analytical Answer Questions
Chapterwise Notes in Q & A Format for Group C ( with TU Soln )
Possible Exam Q & A plus Past Exams Solution from this Group
Q) Explain the effect of shift in demand and supply curve in the equilibrium price and quantity.
Note: These question-topics are already discussed earlier in Group B. Please refer back to the Group for your answers.

Congratulations! You’ve now gone through every type of question that can be asked in your exams from this unit. A next round of revision will certainly help you learn & remember all these answers to your exam questions!